GMAC Diversity Report 2020
(by Marc Ethier for Poets and Quants)
The Graduate Management Admission Council, the organization that administers the GMAT exam required by most business schools in the world, released its annual report with the detailed analysis of the state of diversity in graduate business education.
Quick Facts
- Slowly but surely, women are closing the gap in GMAT testing, as the share of global GMAT exams taken by women has steadily climbed from 40.1 percent to 47.1 percent over the past 10 testing years.
- The GMAT examinee pipeline is growing more geographically diverse, and the center of gravity is shifting east. Ten years ago, in testing year 2010, about half of GMAT exams were taken by US citizens (48%) and 19 percent were taken by citizens of East and Southeast Asia. Flash forward to testing year 2019, and the proportion of exams taken by citizens of East and Southeast Asia has grown to 38 percent, and the proportion taken by US citizens has declined to 28 percent.
- While black and Hispanic bachelor’s and master’s enrollments and conferrals have been on the rise, the selective GME pipeline—specifically the GMAT pipeline—has not experienced the same level of diversification.
- Undergraduates’ curricular interests tend to correspond with their major. For example, art/humanities majors are more likely than other majors to say marketing and communications is a “must-have”, while engineering/computer science and science majors are more likely to gravitate toward business analytics/data science.
- Candidates with more experience are more likely to consider cost-effective alternatives to GME, like professional certifications or MOOCs.
Gender
It’s not yet a woman’s world, but it’s getting there. GMAC reports that while women’s degree attainment has long exceeded that of men, the gap is widening, with women’s overall enrollment growing despite the obstacles — attitudes, beliefs, and professional and educational hurdles — that persist in many parts of the world. “Slow progress is being made,” write Hazenbush and Schoenfeld: While only 6.6% of current Fortune 500 CEOs are women, that is up from just 0.4% two decades ago. Women hold 22.5% of board seats at Fortune 500 companies, up from 16.6% in 2010.
It’s not a pipeline issue. Women have been closing the gap in GMAT testing for years; over the last decade, the share of global GMAT exams taken by women has climbed from 40.1% to 47.1%. Women’s applications have reached or are close to parity in multiple business master’s program types, while continuing to lag behind men in full-time and professional MBA programs, where women account for 39% and 41% of apps, respectively. (See chart below.) 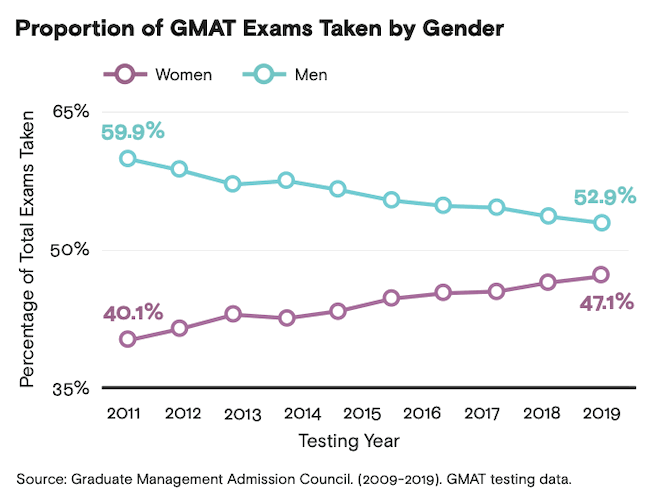
“Compared with their male counterparts, women’s journey to business school can be characterized as being more pragmatic,” GMAC reports. “Female candidates tend to consider GME earlier in their educational and career journeys than men (and) are more likely than men to say that what triggered their pursuit of GME was a skill or credential deficiency, either for a job they want to pursue or for their current job. Across a range of potential barriers to the pursuit of GME, female candidates are more likely than male candidates to say that specific barriers may derail their journey to business school, including factors like admissions requirements, future debt burden, and confidence in their ability to be successful in the program.” Their pragmatism is also reflected in their choice of program: Women are far more likely (45.1%) than men (28.6%) to send their GMAT scores to business master’s programs; see table below. 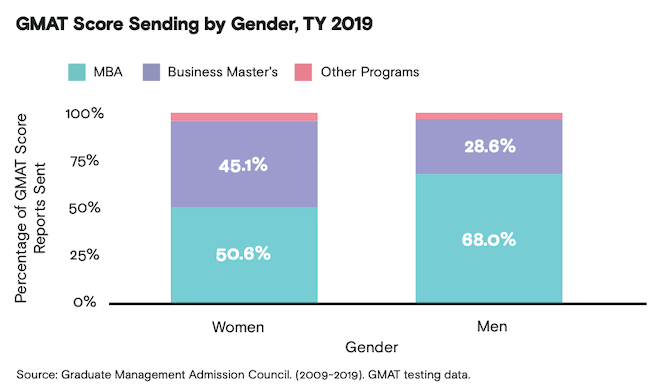 Post-graduation, women’s career goals are not so different than men’s, “though they tend to set different goals and have different priorities.” Women’s top goal (41%) is to make more money; next in line is freedom to travel, followed by management goals (see table below). Women business school candidates are less likely than male candidates to aim for the C-suite, however.
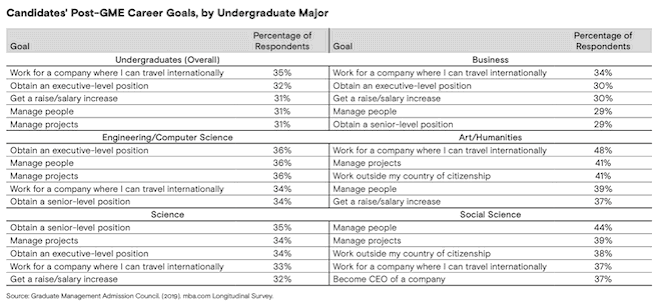
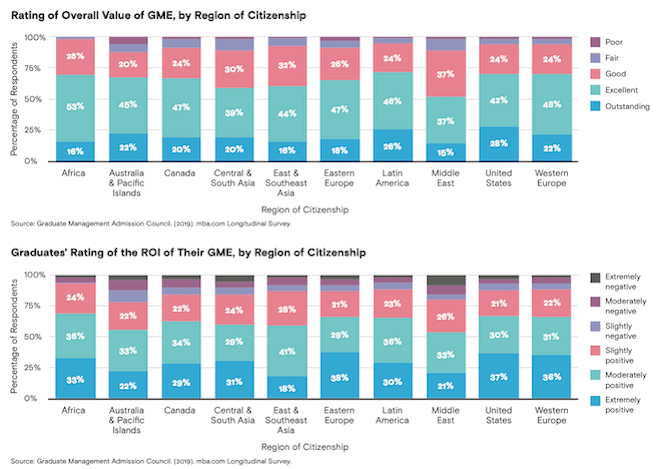
“Female graduates report high levels of satisfaction with their experience and outcomes,” GMAC reports. “The vast majority of female graduates responding to GMAC’s 2019 mba.com Longitudinal Survey rate the overall value of their GME as good to outstanding and say that their GME made their professional situation better.”
U.S. Race/Ethnicity
The U.S. population is changing rapidly — in short, it’s getting more racially diverse. The U.S. millennial generation — those between 21 and 37 years old — is now 44% non-white, compared with just 32% of all those older than millennials. It should come as no surprise, then, that higher-education attainment is on the rise for both black and Hispanic people, with black bachelor’s attainment increasing 29% in the last decade and Hispanic bachelor’s attainment more than doubling in the same period.
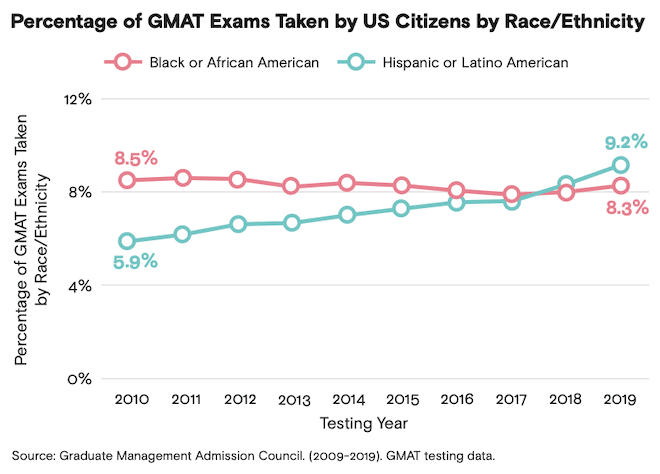
Ten years ago, black U.S. citizens comprised 8.5% of GMAT test takers, while Hispanic students were only 5.9%. Since then, the share of black GMAT examinees has actually shrunk, to 8.3% of the total in the U.S. — while the proportion of Hispanic test takers has surged to 9.2%, an increase of 56%. Meanwhile the post-graduation numbers continue to lag for both groups, with black and Hispanic professionals continuing to be underrepresented populations (URPs) in managerial and executive-level positions: Black professionals account for 4.1% of chief executives in the U.S., and Hispanics account for 6.2%.
“In the context of an overall U.S. candidate pipeline that’s been flat to down for a number of years, these deficits in representation of non-white candidates are particularly troubling because enrollment projections suggest these populations are where future domestic business school recruitment opportunities will be most abundant,” GMAC reports.
According to GMAC, “black and Hispanic candidates predominantly send their GMAT score reports to MBA programs. The top three largest states for black GMAT exams taken are New York, Texas, and Georgia, and the three largest states for Hispanic GMAT exams taken are Texas, California, and Florida. URP candidates tend to consider GME later in their educational and career journeys and are more cost sensitive compared with non-URP candidates, as cost of the program is the most often cited potential barrier to the pursuit of GME among black (60%) and Hispanic (66%) candidates. URP candidates tend to rely more on grants, fellowships, scholarships, and support from parents to finance their degree than U.S. non-URP candidates, and URP candidates are more likely than U.S. non-URP candidates to consider less expensive alternatives to GME, including professional certifications (37%) and/or graduate certificate programs through a university (24%).”
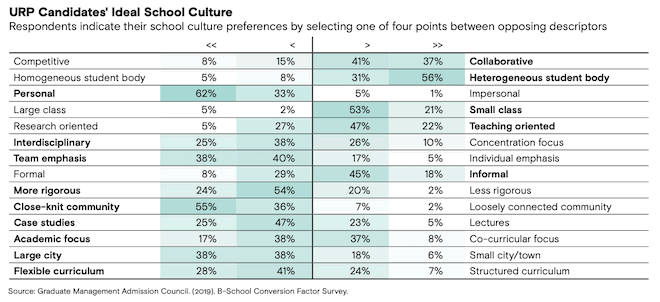
What kind of school culture are URP candidates seeking? One that is collaborative with a team emphasis in a small, close-knit classroom setting. (See table below.) They also want “a rigorous, academically focused, interdisciplinary education centered around case studies, with flexible curricular options.”
URP candidates go to business school because they are primarily planning careers in consulting, technology, and financial services, GMAC reports, and are more interested than non-URP candidates in working in government, media/entertainment, and professional services; they also are interested in marketing/advertising/brand management, human resources, and information technology/data science roles. “In choosing a job,” Hazenbush and Schoenfeld write, “URP candidates are more likely than non-URP candidates to say it’s important that it be high-paying, provide job security, offer the ability to take off time for family or childcare needs, and help society.”
Nationality
The paradigm is shifting: In global higher education, student mobility has long gone from east to west, and that continues — but with changes in China come changes worldwide. “International mobility in higher education in the last decade was driven mostly by China as a source of international students for high-income countries,” GMAC reports. “International mobility in higher education will experience slowing growth in the coming decade, taking into account demographic trends (i.e., declines in the college-age population) as well as investment in domestic higher education, especially in key locations like China and India.” Put more starkly, as the GMAT pipeline becomes more diverse, its center of gravity shifts eastward.
“Ten years ago, in testing year 2010, about half of GMAT exams (48%) were taken by U.S. citizens and 19% were taken by citizens of East and Southeast Asia. Fast-forward to testing year 2019, and the proportion of exams taken by citizens of East and Southeast Asia has grown to 38%, and the proportion taken by U.S. citizens has declined to 28%. International student mobility in GME is in the midst of a rapid shift, as a growing number of Asia-Pacific candidates are opting to stay either in country or in region, and internationally minded candidates are sending more applications to Europe and Canada and fewer to the United States.”
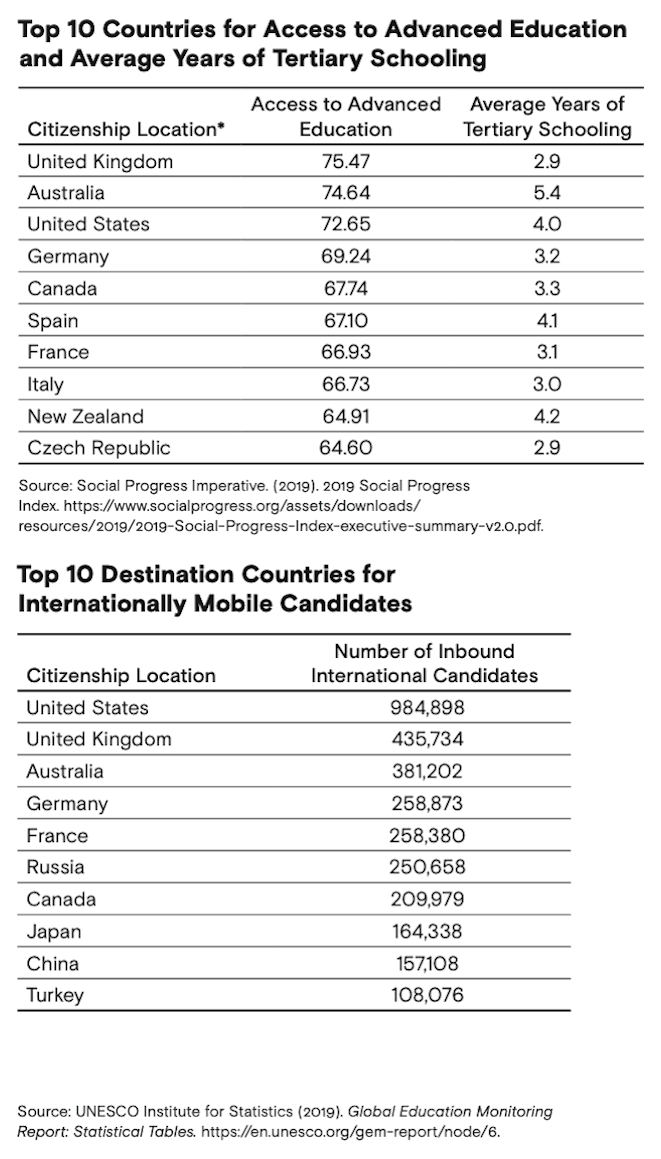
Yet where do students go? Still mostly, by far, the United States. (See second table below.)
Program preferences vary considerably by country, but globally, the MBA continues to be king, in terms of both interest and applications. Some key data points:
- Overall, 4 in 5 business school candidates consider an MBA program type (79%)
- 2 in 3 consider either a full-time one-year or two-year MBA (65%)
- Most candidates in Western Europe (65%), Eastern Europe (55%), the U.S. (54%), and East and Southeast Asia (52%) say they first considered GME before completing their undergraduate degree, whereas in locations like Australia and Pacific Islands and the Middle East, it’s more common to have not considered GME until at least two years in the workplace
- Entrepreneurship is a career goal of nearly half of African GME candidates (43%), well above the global average.
What are candidates” preferences once they have their new degree in hand? “In several parts of the world, candidates’ professional aspirations are informed by their mobility goals,” Hazenbush and Schoenfeld write. “‘Work for a company where I can travel internationally’ and ‘work outside my country of citizenship’ are goals for a third or more of candidates in Africa, Australia and Pacific Islands, Central and South Asia, East and Southeast Asia, Eastern Europe, Latin America, the Middle East, and Western Europe.”
Undergraduate Major
“Popular fields of study vary in different country contexts,” Hazenbush and Schoenfeld write, “with business being among the top fields in many key markets. There is notable variation globally in the proportion of bachelor’s earners who go on to earn a master’s degree.” Bachelor’s-equivalent enrollments increased globally by about 14% in the five years between 2013 and 2018, from 133 million to 152 million, GMAC reports; meanwhile, the GMAT pipeline is growing younger: In the last 10 years, total exams taken by those under 25 has grown from 42% to 52%. In 2019, 33% of examinees had not yet completed their undergraduate degree — with more than half of those who are still undergraduates hailing from China. About 1 in 5 undergraduate exams are taken by U.S. citizens.
Undergraduate examinees primarily send their GMAT score reports to business master’s programs, GMAC writes, which makes sense because across world regions “the greatest proportion of undergraduate GMAT examinees are business majors.” That includes the world region with the highest number of undergraduate GMAT examinees — East and Southeast Asia, where 7 in 10 are business majors. Similarly, most undergrad examinees in the U.S. (72%) and
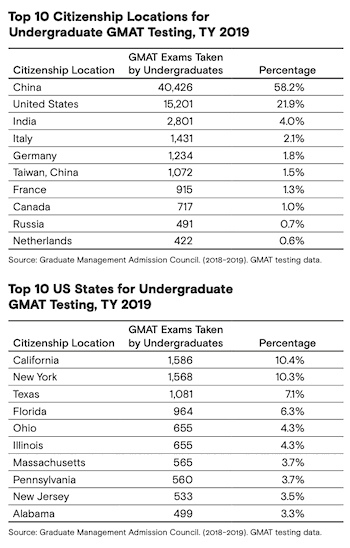 Western Europe (68%) are business majors, as well. There is more variation in other world regions: 47% in Central and South Asia are business majors, for example, while 37% are engineering/computer science majors; in Canada, 50% are business majors, followed by social science (20%), engineering/computer science (13%), and science (13%).
“Most undergraduates who pursue GME say they had always planned to pursue GME at this particular point in their educational journey (63%), though business majors are more likely to say this (65%) than other majors,” GMAC reports. “Compared with business majors, nonbusiness majors are more likely to say that what triggered their consideration of GME was that they wanted to apply for a job, but they lacked the required skills or degree to be competitive, including 39% of art/humanities majors, 39% of social science majors, and 37% of science majors.
“A majority of undergraduate candidates say school prestige/ranking and geographic location influence their application decision, and after candidates have applied and received their decisions, the most important factors influencing their enrollment decision are school prestige/ranking, core curriculum, geographic location, and faculty reputation.
“Undergraduates’ curricular interests tend to correspond with their major.
For example, art/humanities majors are more likely than other majors to say marketing and communications is a ‘must-have,’ while engineering/computer science and science majors are more likely to gravitate toward business analytics/data science. International management/business is at the top of social science majors’ lists, while business majors are more likely than others to express interest in corporate finance.”
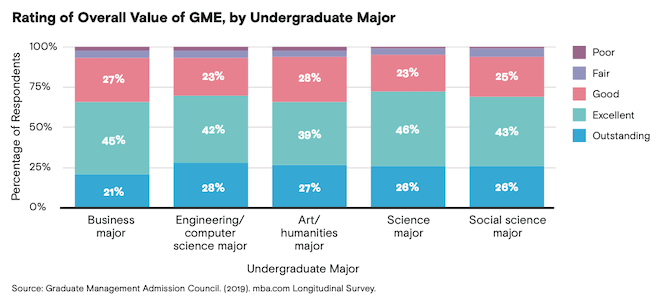
Those happiest with their GME experience: surprisingly, not undergraduate business majors. While 66% of business majors rated the value of their GME as outstanding or excellent, 72% of science majors and 70% of engineering/computer science majors did so (see table above). And once all is said and done, what are the top career goals for the new graduate business degree holders? Among all majors, most (35%) say they want to work for a company for which they can travel internationally, with similar numbers seeking to obtain an executive-level position (32%), get a raise or higher salary (31%), manage people (31%), and manage projects (31%). Among business majors, travel wins again (34%), followed by obtaining an executive position (30%), getting a raise/bump in salary (30%), managing people (29%), and obtaining a senior-level position (29%) — see table below.
Work Experience
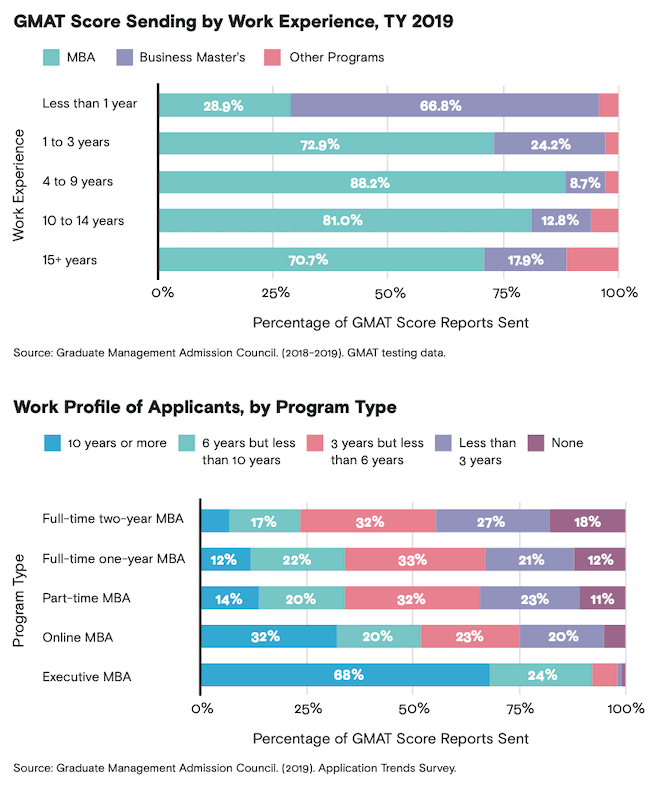
“The more experience a candidate has, the more likely they are to apply to a professional MBA program type and less likely to apply to a full-time MBA program,” GMAC reports. More than 7 in 10 GMAT score reports that are sent by examinees with more than one year of professional experience go to MBA program types; among examinees with less than four years’ experience, most score reports — 58.5% — are sent to full-time MBA programs. As years of experience increase, fewer score reports are sent to full-time MBA programs, and more go to professional MBA program types.
Candidates with more professional experience tend to have made the decision to pursue GME later in their professional journeys,” GMAC reports, adding that 45% of candidates with seven or more years’ experience say they first considered B-school after more than five years of working. “Candidates with more experience are more likely to consider cost-effective alternatives to GME, like professional certifications or MOOCs. Experienced candidates are more likely to seek flexible program options, like online coursework and weekend or evening scheduling. Overall, the top curricular subjects experienced business school candidates say are a “must- have” in their ideal curriculum are strategy, leadership/change management, and business analytics/data science. Candidates’ interest in co-curricular activities tends to decrease with more years of work experience.”
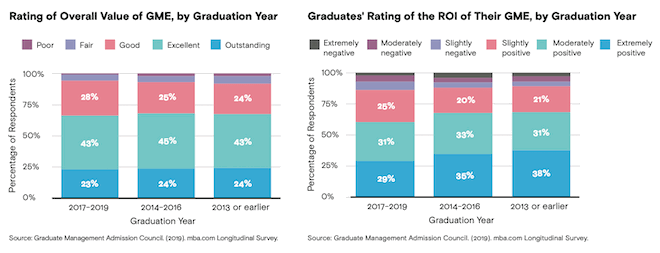
“Experienced professionals,” GMAC reports, “pursue GME to earn more money and gain more responsibility. Those with seven or more years’ experience tend to be aiming to break into senior- or executive-level positions, while those with less than four years’ experience tend to be focused on gaining responsibilities like managing people and projects.” Since 2013, graduates’ view of the value of their master’s degree has changed little (see table above); however, their rating of the overall ROI has dropped considerably. Those rating as “extremely positive” their GME experience has dropped from 38% to 29%, while “slightly positive” has increased from 21% to 25% and both “slightly negative” and “moderately negative” have gone up.


